
In January 2026, Indian bullion markets printed levels that few domestic investors had seen before: gold approached ₹1.55 lakh per 10 grams and silver crossed ₹3 lakh per kilogram on domestic boards. By month-end, gold was near ₹1.46 lakh per 10 grams while silver reached roughly ₹3.05 lakh per kg as momentum extended through the final sessions.
Headline milestones attract attention, but they rarely tell the full story on their own. This guide is the single reference for that January surge — session-by-session price movement, the five macro drivers behind the rally, how today's records compare with past Indian bullion peaks, and practical questions investors should ask before acting. Confirm live levels on the gold price today and silver price today pages before purchasing.
Key Takeaways
- Gold moved from roughly ₹1.41 lakh to ₹1.46 lakh per 10 grams across four January sessions; silver rose from ₹2.88 lakh to ₹3.05 lakh per kg in the same window.
- The rally was driven by a blend of safe-haven demand, inflation concerns, rate expectations, industrial silver consumption, and dollar/rupee moves — not a single headline event.
- Silver's smaller market and industrial demand channel produced sharper percentage swings than gold during the same phase.
- Crossing ₹3 lakh silver and ₹1.45 lakh gold is historically significant, but Indian bullion has redefined "record" many times before — context matters more than round numbers.
- A single day's milestone print is not a buy or sell signal; compare the session trend, dominant driver, and your own time horizon before acting.
January 2026 Price Levels at a Glance
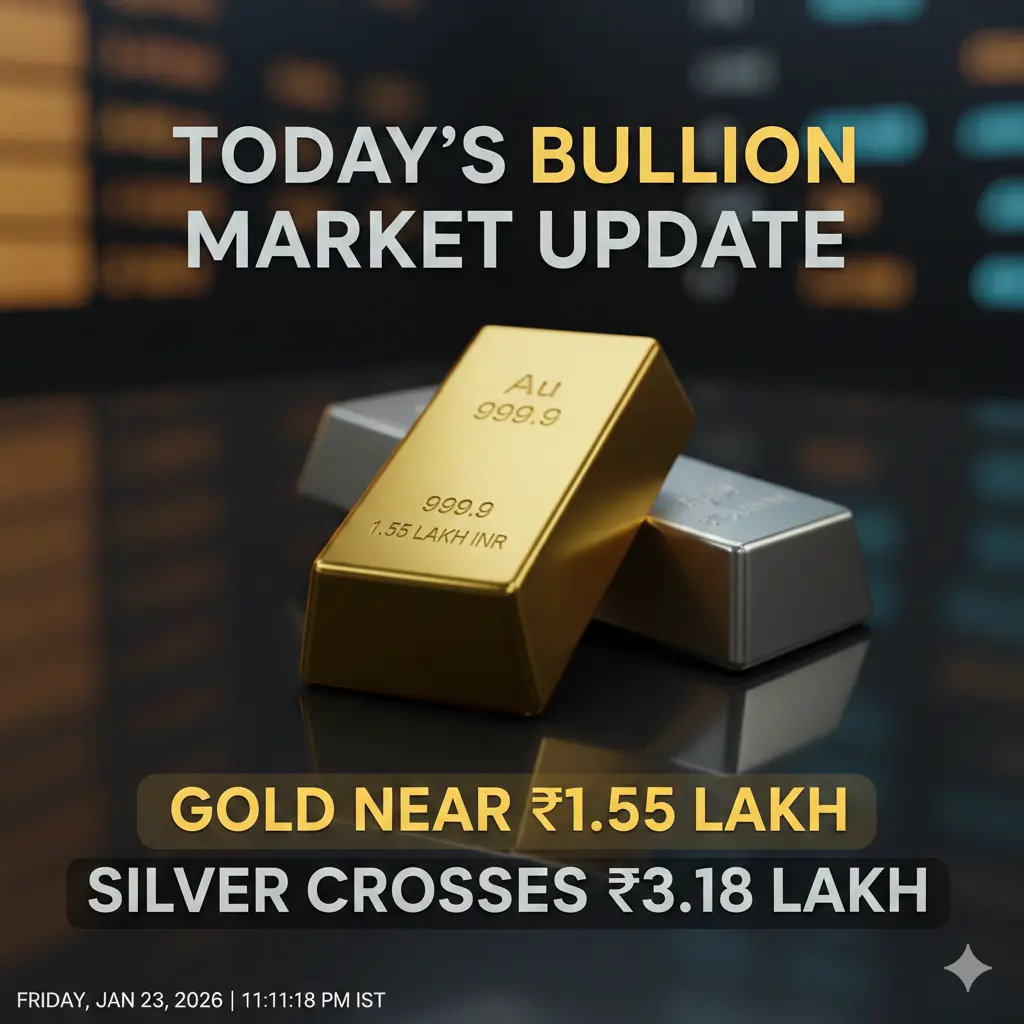
Reports tied to the peak of this move often cited gold near ₹1.55 lakh per 10 grams and silver near ₹3.18 lakh per kilogram in domestic channels. The chart below uses rounded illustrative figures for layout — always confirm live quotes on MCX or your dealer feed.
Session-by-Session Price Trend
The table tracks how domestic bullion levels moved across four consecutive sessions during the January rally. Figures are illustrative snapshots from that period.
| Date | Gold (₹ / 10g) | Silver (₹ / kg) | Trend |
|---|---|---|---|
| Jan 27, 2026 | ₹1.41 Lakh | ₹2.88 Lakh | Stable |
| Jan 28, 2026 | ₹1.43 Lakh | ₹2.92 Lakh | Moderate Rise |
| Jan 29, 2026 | ₹1.45 Lakh | ₹2.98 Lakh | Strong Demand |
| Jan 30, 2026 | ₹1.46 Lakh | ₹3.05 Lakh | Bullish Momentum |
Commodity markets rarely move in a straight line. Short-term corrections are common as traders book profits after strong rallies, even when the longer-term trend remains intact.
Five Drivers Behind the January Rally
The move was influenced by several global economic factors working together rather than a single trigger.
1. Global Economic Uncertainty
Investors typically move toward safer assets during uncertain periods. Gold has historically served as a store of value during financial instability.
2. Inflation Concerns
Inflation reduces purchasing power. As inflation expectations rise, investors often turn to gold as a hedge against declining currency value.
3. Interest Rate Expectations
Central bank policies strongly influence precious metals. When rates stabilize or markets price future cuts, gold often gains momentum.
4. Industrial Demand for Silver
Silver plays a critical role in solar energy, electronics, batteries, and electric vehicles. Growing demand in these sectors supported silver prices alongside investment flows.
5. Currency Movements
Gold and silver trade globally in US dollars. A weaker dollar makes metals more attractive internationally; rupee moves further adjust domestic Indian quotes.
Analyst commentary rarely isolates one driver. The horizontal bars below are a stylised mix mirroring the five themes — not a measured econometric model.
Gold vs Silver: Why Silver Moved Faster
| Feature | Gold | Silver |
|---|---|---|
| Primary Use | Safe-haven investment and jewellery | Industrial and investment metal |
| Market Size | Larger and more stable | Smaller and more volatile |
| Price Volatility | Lower | Higher |
| Industrial Demand | Limited | Strong — solar, EV, electronics |
| Typical Investors | Central banks and institutions | Retail traders and industries |
With both metals in an uptrend, percentage swings in silver often outpace gold because the market is thinner and industrial narratives can turbocharge sentiment. The indexed line chart below illustrates that pattern in principle (base = 100).
Record Levels in Historical Perspective
Crossing ₹3 lakh silver and ₹1.45 lakh gold is striking, but milestones matter most in context. Indian bullion has repeatedly redefined what counts as a "record" — each previous peak, from the 1980 spike to the 2011 surge and the 2020 pandemic rally, once looked equally extraordinary before becoming a reference point.
What makes the January 2026 move distinctive is that gold and silver set highs together, with silver's industrial-demand story adding a second engine that earlier gold-led rallies lacked. On MCX, both metals traded near record territory as global macro developments and strong domestic investor demand converged.
How to Interpret Milestone Prices
Round-number milestones like ₹1.46 lakh gold or ₹3.05 lakh silver attract headlines, but a single day's print is not a buy or sell signal on its own. Compare the level with the session trend in the table above, check whether the move is broad (both metals rising) or silver-led, and confirm against your live dealer or MCX feed before acting.
For portfolio decisions during a record-price phase, our gold vs silver investment guide explains how to weight the two metals without chasing vertical moves. For volatility mechanics, see why silver is volatile and why gold corrects.
What Could Happen Next?
After a strong rally, short-term pullbacks are common in commodity markets. The longer-term outlook depends on inflation trends, interest rate policies, economic growth, and geopolitical developments. If economic uncertainty remains elevated, precious metals may continue attracting investment demand — but timing entry at record highs requires discipline rather than headline reaction.
Frequently Asked Questions
1. Why did gold and silver rise sharply in January 2026?
A combination of safe-haven demand, inflation concerns, rate expectations, industrial silver consumption, and currency moves supported both metals — not a single isolated event.
2. Why did silver outperform gold during the January 2026 rally?
Silver's market is smaller and its industrial channel (solar, EV, electronics) was aligned with investment flows that week, producing sharper percentage gains than gold's safe-haven move alone.
3. What price levels triggered the January 2026 headlines?
Gold approached ₹1.55 lakh per 10 grams and silver crossed ₹3 lakh per kg on MCX — both record territory for that period, with both metals setting highs together rather than a gold-only rally.
4. How do January 2026 levels compare with past Indian bullion peaks?
Today's records sit within a long arc of redefined highs. What is distinctive is gold and silver setting highs together, with silver's industrial channel adding momentum that earlier gold-led rallies often lacked.
5. Did MCX futures gap on the rally days?
Yes. Overnight global moves in COMEX and LBMA often print as opening gaps on MCX when Indian markets reopen — especially after US sessions while India was closed.
Data Sources and References
- Multi Commodity Exchange of India (MCX) — official commodity trading exchange providing real-time gold and silver futures prices in India.
- World Gold Council — global research on gold demand, supply, and investment trends.
- London Bullion Market Association (LBMA) — international precious metals standards and pricing benchmarks.
- Reserve Bank of India (RBI) — economic reports, currency data, and policy updates affecting domestic bullion pricing.
- International Monetary Fund (IMF) — global economic outlook reports influencing commodity markets.
Conclusion
The January 2026 surge — from ₹1.41 lakh to ₹1.46 lakh gold and ₹2.88 lakh to ₹3.05 lakh silver across four sessions — reflects inflation concerns, safe-haven demand, industrial silver consumption, and currency movements working together. Understanding which driver dominated on a given day matters more than reacting to any single headline print.
Treat milestone prices as context, not signals: check the session trend, identify the dominant macro driver, and align any purchase with a longer-term plan rather than headline momentum alone.
Disclaimer: This article is for informational and educational purposes only. Precious metal investments are subject to market risks. Chart and table figures use illustrative data from the January 2026 rally period; verify live prices and consult a qualified financial professional before investing.